Observability Principles and Recipes for Modern Systems
Observability plays a crucial role in understanding how a system operates and diagnosing why issues occur. By applying observability principles, organizations can proactively monitor infrastructure, applications, and user experience. This helps improve decision-making across DevOps, DevSecOps, DataOps, Cloud, and more.
In this guide, we’ll explore the fundamental principles of observability, its main components, and practical recipes for applying it effectively. Additionally, we’ll showcase how ZippyOPS can support your needs through consulting, implementation, and managed services.
What Is Observability?
Observability is the ability to gain insights into a system’s state and behavior, not just monitor its performance. It’s about understanding the reasons behind system behavior, enabling teams to identify and resolve issues faster.
Importantly, observability isn’t confined to infrastructure alone; it spans applications, microservices, cloud environments, and AI/ML pipelines. ZippyOPS, for example, integrates observability solutions into DevOps, Cloud, Security, and more, offering tailored services.
Guiding Principles for Observability
- Contextual Flow Matters
Effectively captures the flow of each request. It’s crucial to understand what failed, which components were impacted, and common patterns when things go wrong. - Flexible Data Correlation
Systems should allow teams to view data from multiple angles—user, session, server, etc. This approach helps quickly pinpoint issues across different layers of the system. - Question-Driven Design
Instead of relying solely on available data, observability should focus on answering specific operational questions. This helps identify system gaps and better prioritize improvements.
ZippyOPS assists organizations in applying these principles through a variety of solutions that span DevOps, Cloud, Security, and Microservices Explore our solutions.
Core Components of Observability
There are several key components. Each serves a unique purpose in providing insights:
Metrics
Metrics offer numerical values that represent a system’s performance over time. Some examples include:
- Uptime
- Response time
- Requests per second
- CPU/RAM utilization
These metrics help track performance trends and detect potential capacity issues.
Events
Events capture significant occurrences in the system, helping correlate data with operational changes. Examples include:
- Workflow status updates
- Batch job completions
Events provide context for troubleshooting and performance analysis.
Logs
Logs are essential for understanding issues and diagnosing problems. They offer detailed context that helps recreate and resolve system failures. Common examples include:
- Application logs
- Server logs
- Error logs
- Debug logs
Traces
Traces reveal the journey of a request as it moves through a system. They help identify bottlenecks and errors, providing specific insights that can drive system optimization.
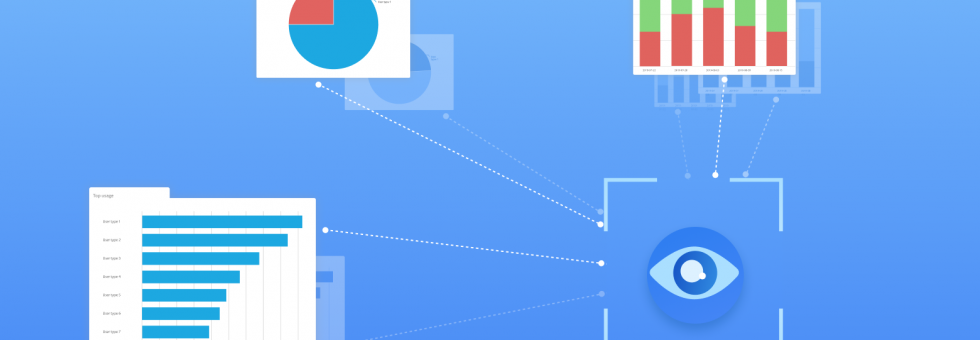
Visualization
Visualization tools connect metrics, events, logs, and traces into a cohesive, easy-to-understand format. These visualizations make it easier to spot patterns and correlations that may not be immediately obvious from individual data points. ZippyOPS offers real-time visualization features in its products for improved monitoring and decision-making.
For additional insights, you can explore the CNCF Observability Landscape, which outlines popular observability tools.
Observability Recipes
Turning observability into actionable recipes allows teams to map questions to necessary data points. This approach ensures comprehensive coverage and simplifies both new and existing system implementations.
Example Recipes
| Use Case | Questions to Ask | Metrics | Events | Logs | Traces | Visualization |
|---|---|---|---|---|---|---|
| System Health | Are all components running? Are servers at max capacity? | CPU/RAM usage, Network latency & throughput | Service start/stop status | N/A | N/A | Health dashboards |
| Application Performance | How fast are services? Why performance declined? | Response times, payload size | Events linked to metrics | N/A | Top 10 slow transactions | Performance dashboards |
| User Experience | Which browsers are users on? On-page performance? | Page load time, DOM size, Ajax response | N/A | N/A | User journey tracking | UX dashboards |
| Exception Management | Are there errors or broken pages? | Server errors/min, page errors | Standardized error events | Stack trace & debug logs | Call graphs | Error dashboards |
Additional use cases include Release Management (tracking deployment issues) and Security Monitoring (detecting breaches and abnormal user behavior). ZippyOPS can help integrate observable across DevSecOps, Security, and Automated Ops Learn more.
Implementing Observability with ZippyOPS
ZippyOPS provides specialized consulting, implementation, and managed services across observable domains. Their expertise includes:
- DevOps & DevSecOps
- DataOps & MLOps
- Cloud & Microservices
- Automated Ops & Infrastructure
- Security monitoring
By leveraging ZippyOPS solutions, teams can implement observability frameworks that seamlessly integrate with existing systems. Check out our products and solutions for more details.
For demos, tutorials, and more, visit the ZippyOPS YouTube channel.
Conclusion
In modern IT environments, observability is essential for gaining insights into system health and performance. By integrating metrics, events, logs, traces, and visualizations, organizations can more effectively troubleshoot and optimize their systems.
ZippyOPS provides comprehensive observable services across DevOps, Cloud, Security, and more. These solutions help businesses improve visibility, accelerate troubleshooting, and drive performance improvements.
For professional assistance, contact sales@zippyops.com to get started today.